
Hey, what's up guys? This is Jeremy Ashman with Ashman Realty Group. Today we're going to look at some incredible housing stats for the city of Atlanta. Everyone knows that the housing market is going crazy. I want to show you some data points that really talk to this. I've pulled a few different major cities in north Atlanta, obviously Roswell being one of them.
Roswell Home Inventory
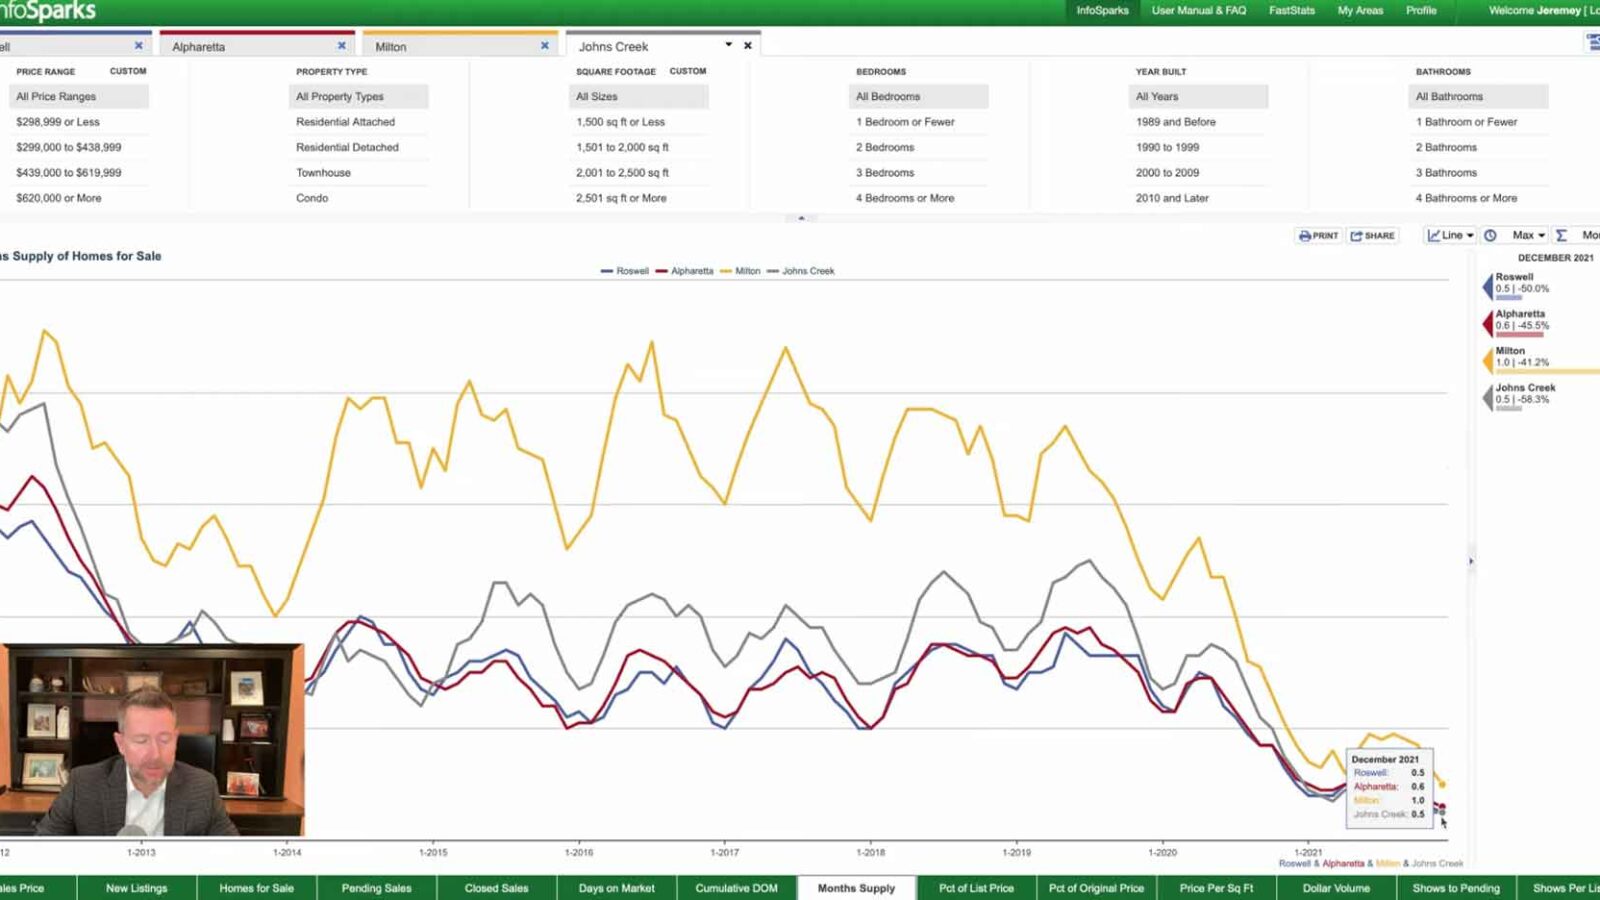
Okay. So the first thing we're going to look at is the month supply of homes. If we look back at our history, you can see that usually we have about a two to four month supply of homes on the market. Since April, May, June, where we were at normal inventory levels 2020, since that time we really have plummeted and our inventory levels are just... We don't have enough on the market. This is incredible to see these inventory levels so low.

The second thing I'm going to show you is how many showings per listing and you can see typically our showings are somewhere between 5 and 10 showings. Since July of 2020, August of 2020, things really took off. You can see now that in Roswell, Alpharetta, Johns Creek, we're getting between 15 and 30 showings per listing. So this shows the amount of demand when a house goes live.
Roswell Home Sales - Average Showings Per Listing

Roswell Home Listings - Average Days On Market
Now another interesting point on this is actually how many days on market these homes are sitting. Normally we're fluctuating right around 20 to 40 days on the market. But again, if we look at this middle of 2020 and what's happening the last year, days on market of less than 10 and floating right around 5, 4, 5, 6, 7 days on market.

So if we just sum these three things up, we have no homes on the market. The number of showings are incredible. 15 to 30 showings per home. The home is only sitting for a few days on the market.
Roswell Home Sales - Average Price Per Square Foot
And then lastly, we're going to check out what this supply and demand has done to our price per square foot. For many years we were floating right around $140 to $160 a square foot, and just kind of slowly, gradually rising, which is very typical for the housing market. Now with the supply and demand issues that we have been dealing with since about mid 2020, right here, mid 2020, you can see what this has done to our price per square foot.

In Roswell we went from $158 a square foot all the way up to $201 per square foot in. In Alpharetta we went from 159 per square foot. We're now up at $216 a square foot. In Milton we were at $164 a square foot. We are now up at 230. Then John's Creek we are at $150 a square foot. Now we're up at 200. So these are in incredible numbers.
I hope you found this helpful. Unless things change we're going to continue to see a rise in pricing. It's going to be interesting to see how our market reacts when the fed raises interest rates. Stay tuned. I'll keep you updated. And hope to see you soon.
Thanks for Joining Us!
Thanks for joining us for this episode of Living in Roswell GA Guide. If you have a spot you'd like for us to highlight in Roswell, please call us at the numbers below. We'll see you next time!

